It's easy to find mortgage calculators online. But they are not always set up for New Yorkers, who tend to be buying co-ops, and I wanted to analyze the costs in more detail. I set up my own "rent vs. buy" housing cost calculator in Excel using these steps. I won't go into the details of the formulas-- you can download the spreadsheet to see them.
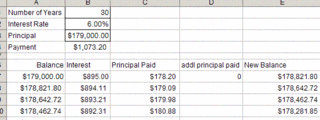
First I generated a payment table for the loan. This tells you the total payment, and how much is interest and how much is towards the principal, with variables for the term of the loan, interest rate, and amount.
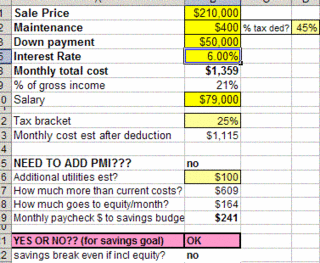
I then incorporated this into another worksheet with information about my income, tax bracket, and other factors about the property I'd be buying: maintenance fees, tax deductibility of maintenance and utility costs. It's set up so you just enter the variables in the shaded boxes, and it references the results from the payment table. So it tells me how much I'll pay, before and after taxes, and what percentage of my gross income the payments are. But there are other factors I want to consider.
When people tell you why you should buy vs. rent, they always say it's because the money builds up equity instead of just going out the window. But there are still "out the window" costs when you buy: the non-tax-deductible part of your interest and maintenance payments. Right now, I pay $850 in rent, which all goes out the window. So am I saving more money if I buy an apartment and am building equity? Maybe. In the example in the screen shot, even after you account for equity and tax deductions, my out the window costs are actually higher if I buy this apartment. That might be okay up to a point, (and of course equity also builds up by the value of the property increasing ) but it's something I want to be aware of. I have to really believe it's worth it to have that much more money go out the window every month, which is on the spreadsheet as "non-equity costs."
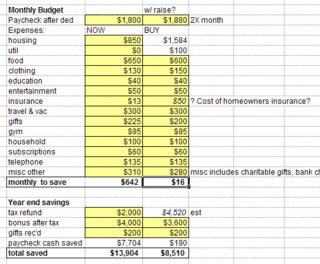
Then I have to see how the cost of ownership matches up to my paycheck and other expenses. Will I still be able to meet savings goals if I buy? Will I be able to maintain my current lifestyle? I added a simplified budget of expenses that come out of my paycheck cash. (To keep things easy, I left out taxes and payroll deduction items.) I'm not willing to go into the red every month, even knowing that I'll get some of the money back as a tax refund.
I made a "NOW" and "IF I BUY" column, so I could adjust for the raise I should be getting soon, and cutbacks I'll try to make in spending. "NOW" is averaged out based on the past year's expenses. I then take the monthly expense averages vs paycheck cash, tax refund and bonus, and calculate a year end net.
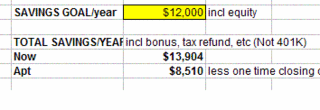
I also added a savings goal section. I set this up as a goal that would include the equity I'd be building, as well as cash-only savings below. These don't include my 401k,or interest/investment income that goes into savings. Then it all comes together here:
It tells me how much I'm spending and saving, and if I can't meet my savings goals, it tells me "NO!!" I also added a calculation that would tell me if I am breaking even with my current savings level if I include the equity build-up.
Here's a different example of a scenario that would actually be affordable for me-- if I'm meeting my savings goal, the pink box says "OK":
I think the usual guidelines-- that you should pay 30% of your income towards housing, or that you can qualify for a mortgage that is 2.5 times your gross salary-- are too broad. They just don't take into account the reality of people's lives and their real goals. I had fun putting this calculator together and playing around with the different scenarios. It puts things in a different perspective when you see how a change in one part of your spending can affect your ability to buy a home. I'm sure the worksheet could be made prettier and other bells and whistles could be added, but if you want to use it as it is, or just check it out and make comments or improvements, you can download it here.
Sunday, August 21, 2005
Real Estate Cost Analysis Tool
Posted at 12:31 PM
Labels:
excel charts,
real estate
![]()
Subscribe to:
Post Comments (Atom)

4 comments:
your excel-fu is very powerful ;)
Great post. It's probably too many variables for this "estimation" stage, but don't forget that once you have real numbers you can calculate your witholding based on your new deductions (mortgage interest, taxes etc) so you don't have to "wait for a refund" but get more of your money in each paycheck and come out near even at tax time. IRS has an online calc for this, I do it every year and adjust my allowances accordingly -- ok, I actually forgot last year and ended up with a whopper of a refund ;)
How did you post your excel sheets? That's really cool
Whenever I have purchased property or am thinking about purchasing, I run similar excel spreadsheets.
It is very useful in the decision making process, since you can run different properties and compare the characteristics.
Glad to see I'm not the only math-head out there.
I turned screenshots into jpegs for the images in the post, and used a site called FilePost.us to host the file for downloading.
Post a Comment