E*Trade's performance graphs are finally working again. Here's mine: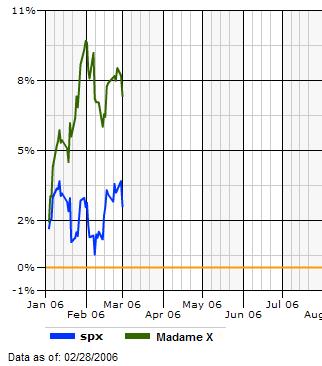
I'm beating the Dow and NASDAQ too. Bully for me.
Wednesday, March 01, 2006
I must be doing something right.
![]()
Subscribe to:
Post Comments (Atom)
E*Trade's performance graphs are finally working again. Here's mine:
I'm beating the Dow and NASDAQ too. Bully for me.
![]()
 Subscribe to my feed


Template modified from www.templatepanic.com

7 comments:
nice!
i'd like to have a graph like that one day... =(
Congratulations on beating the market!
I'm curious to know whether you ever rebalance your holdings by selling portions of your high performers?
Nice job. I will have to go check my graph if they are working now. Unfortunately, mine is not at nice because I was an idiot and didn't sell TMIC when I had a 50% gain on it. Now I am -2% on that one. OUCH!
-RS
Scratch that TMIC %...I just checked and I am now down -6.5% on it. This is why I just invest in index funds with Vanguard now.
-RS
So far, I haven't done much rebalancing other than buying new mutual funds-- but this year I will be selling off a variety of things-- I already got rid of some underperformers, and will be selling some of the good stuff later this year to come up with the rest of the downpayment for the apartment I'm buying.
This is not investment advice, but:
Personally if I knew that I was going to need to liquidate a lot of investments in the near future, I probably would start cashing out ahead of time. Otherwise I would be worried about the possibility of an untimely market downturn right before I needed to sell.
Your chart and the chart below are married to each other. Are you just holding a more concentrated version of the S&P? Or the S&P leaders?
Yeah...I'd be worried and start cashing out of the long-term capital gains holdings now while you can.
Post a Comment